In this post, we will learn about
For simplicity, let us take the case of a yes or no - binary classification problem. We have eight observations. You have built a model to predict the classes. Both actual classes and also the model predicted classes are given below.
For better understanding, I have added the following columns to the table in a separate table below:


Accuracy alone is not a useful measure whenever there is class imbalance. For example, in a binary classification involving 50 actual 'yes' and 5 actual 'no', a model which classifies every observation as 'yes' is also having an accuracy level of 90%. In such cases, relying only on accuracy will not give the real picture as the model which did not predict 'no' also did pretty well on accuracy measure. Precision, recall, F scores, area under ROC curves can be useful in such cases.
In sklearn, we have the option to calculate fbeta_score. F scores range between 0 and 1 with 1 being the best. The beta value determines the strength of recall versus precision in the F-score. Higher the beta value, higher is favor given to recall over precision. If beta is 0 then f-score considers only precision, while when it is infinity then it considers only the recall. When beta is 1, that is F1 score, equal weights are given to both precision and recall.
In fact, F1 score is the harmonic mean of precision and recall.
However, F scores do not take true negatives into consideration. Other improved measures are
AUC is the probability of correct ranking of a random “positive”-“negative” pair (more about this)
Another useful function is classification report. This provides the precision, recall, f1-score and support (number of true instances per label). In the below picture, we can see that there are two rows: yes and no.
In the above example, we have calculated the precision and recall values considering 'Yes'. Here we also have precision and recall values considering 'No'. In case of 'no' class, precision is 'whether predicted No was correct?'. The value is 3/4=0.75. And, recall is 'whether actual no was correctly predicted?'. Here the values is 3/5 = 0.60.
The last row 'avg/total' is the weighted average, weighted according to support. For example, precision is 0.66 which is = ((0.75*5)+(0.50*3))/8. You can also change the way these averages are calculated (more about this).

- What is accuracy
- What are precision, recall, specificity and F score
- How to manually calculate these measures
- How to interpret these measures
- What is confusion matrix and how to construct it
- What is the AUC score and its interpretation
- How to get confusion matrix and classification report in sklearn
Confusion matrix is an important tool in measuring the accuracy of a classification, both binary as well as multi-class classification. Many a times, confusing matrix is really confusing! In this post, I try to use a simple example to illustrate construction and interpretation of confusion matrix.
Example
Actual class
|
Predicted class
|
Yes
|
Yes
|
Yes
|
No
|
Yes
|
Yes
|
No
|
No
|
No
|
Yes
|
No
|
Yes
|
No
|
No
|
No
|
No
|
For better understanding, I have added the following columns to the table in a separate table below:
- Whether our prediction right?
From this column, we can calculate the accuracy of the model. Whenever the classes in both actual and predicted classes match, 'yes' was entered in this column. The total 'yes' to total observations was 5/8 (62.5%) which is nothing but the accuracy of this model.
- Whether 'actual yes' was correctly predicted?
- Whether 'actual no' was correctly predicted?
- Whether 'predicted yes' was a correct prediction?

The same data can also be presented in contingency table which is called as confusion matrix. In Wikipedia examples, rows of the confusion matrix represent predicted class, whereas in sklearn output rows correspond to actual class. To make it easier to understand the sklearn output, I am also representing actual classes row-wise and predicted classes column-wise.

When accuracy is not be useful?
Accuracy alone is not a useful measure whenever there is class imbalance. For example, in a binary classification involving 50 actual 'yes' and 5 actual 'no', a model which classifies every observation as 'yes' is also having an accuracy level of 90%. In such cases, relying only on accuracy will not give the real picture as the model which did not predict 'no' also did pretty well on accuracy measure. Precision, recall, F scores, area under ROC curves can be useful in such cases.
F score
In sklearn, we have the option to calculate fbeta_score. F scores range between 0 and 1 with 1 being the best. The beta value determines the strength of recall versus precision in the F-score. Higher the beta value, higher is favor given to recall over precision. If beta is 0 then f-score considers only precision, while when it is infinity then it considers only the recall. When beta is 1, that is F1 score, equal weights are given to both precision and recall.
In fact, F1 score is the harmonic mean of precision and recall.
However, F scores do not take true negatives into consideration. Other improved measures are
- Matthews correlation coefficient (a value of +1 means perfect prediction, 0 means average random prediction and -1 means inverse prediction).
- Youden's J statistic (Sensitivity+specificity -1)
- Cohen's kappa
- Receiver Operating Characteristic (ROC) curve: In ROC curve, we plot sensitivity against (1-specificity) for different threshold values. Area under the ROC Curve (AUC) curve is called AUC. Each point on the ROC curve represents a separate confusion matrix. There are many ways to interpret the AUC, but the definition I found easier is this one:
How to get classification report and confusion matrix in sklearn?
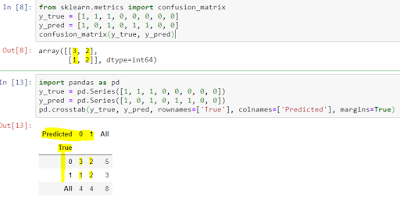
In sklearn, we can use the confusion matrix function to get the results as shown below.
I have coded 'yes' as 1 and 'no' as 0.
To show the rows and columns I have used pandas crosstab option for comparison.

Another useful function is classification report. This provides the precision, recall, f1-score and support (number of true instances per label). In the below picture, we can see that there are two rows: yes and no.
In the above example, we have calculated the precision and recall values considering 'Yes'. Here we also have precision and recall values considering 'No'. In case of 'no' class, precision is 'whether predicted No was correct?'. The value is 3/4=0.75. And, recall is 'whether actual no was correctly predicted?'. Here the values is 3/5 = 0.60.
The last row 'avg/total' is the weighted average, weighted according to support. For example, precision is 0.66 which is = ((0.75*5)+(0.50*3))/8. You can also change the way these averages are calculated (more about this).

Summary
In this post we have seen
- What is accuracy, precision, recall, specificity and F score
- How to calculate and interpret these measures
- How to construct a confusion matrix
- What is the AUC score and its interpretation
- How to get confusion matrix and classification report in sklearn
If you have any questions or suggestions, please feel to share. I will be happy to interact with you.