In this post, we will discuss about
Outliers are abnormal values: either too large or too small. Causes for outliers could be
If it is due to observational error, then again we can try to find the true value through calibration or through averaging. I have summarized the important concepts of observational error which has two additive errors: systematic error and random error.


If we can't rectify the outliers, then we may think of some the following methods to handle outliers.

If you have any questions/suggestions, do share. I will be happy to interact with you.
- How to identify outliers
- How to handle the outliers
Outliers are abnormal values: either too large or too small. Causes for outliers could be
- Mistake in recording, entry or processing
- Observational error
- Or it could be a true observation
If it is due to observational error, then again we can try to find the true value through calibration or through averaging. I have summarized the important concepts of observational error which has two additive errors: systematic error and random error.
Observational error/measurement error
Systematic error
|
Random errors/statistical error
| |
Example
|
A balance showing non-zero value even when no weight is placed on it.
Let us say, if it shows 0.5 kg instead of 0, we can find out the true weight by deducting 0.5kg from the actual reading.
|
Measurement affected by surrounding environment
|
Nature
|
It is predictable.
Constant or proportional to the true value
|
Not predictable.
Vary from observation to another
|
Can we eliminate?
|
Possible to eliminate.
|
Always present in a measurement.
Can be removed by taking multiple observations and then averaging.
|
How to detect outliers
- Box Plot
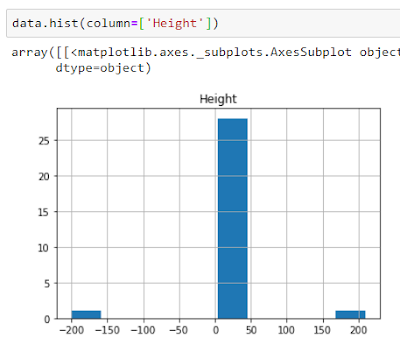
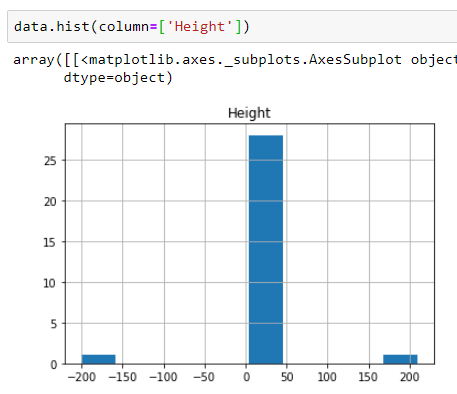
For explaining, I have created a data set called data which has one column i.e. Height. In this I have incorporated two values: one which is too large (209) and the other which is too small (-200) while the mean height is 14.77. Box plot detects both these outliers.

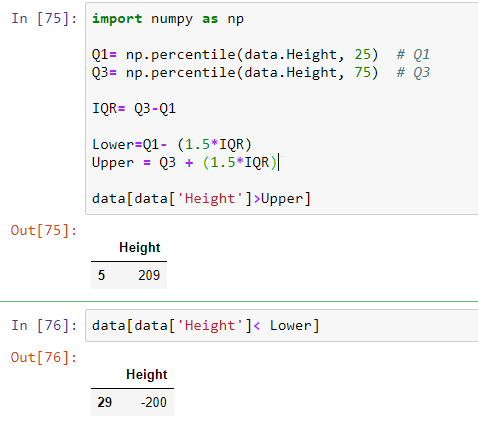
- Interquartile Range (IQR) based method
The same concept used in box plots is used here. We identify the outliers as values less than Q1 -(1.5*IQR) or greater than Q3+(1.5*IQR).
- Standard Deviation based method
In this method, we use standard deviation and mean to detect outliers as shown below.

- Histogram
Histogram also displays these outliers clearly.
- Scatter Plot
If there are more than one variable and scatter plot is also useful in detecting outliers visually.
Handling Outliers
If we can't rectify the outliers, then we may think of some the following methods to handle outliers.
- Doing nothing
- Deleting/Trimming
Be careful as this may lead sampling bias. As professor Patrick Breheny points out throwing away outliers may be simplest method but it threatens scientific
integrity and objectivity. He cites the example of how NASA missed detecting hole in the
ozone layer thinking that it might be an outlier data.
After deleting the outliers, we should be careful not to run the outlier detection test once again. As the IQR and standard deviation changes after the removal of outliers, this may lead to wrongly detecting some new values as outliers.
- Winsorizing
Unlike trimming, here we replace the outliers with other values. Common is replacing the outliers on the upper side with 95% percentile value and outlier on the lower side with 5% percentile.

- Transformation
Use transformation such as log transformation in case of right tailed distribution.
- Binning
Binning or discretization of continuous data into groups such low, medium and high converts the outlier values into count values.
- Use robust estimators
Robust estimators such as median while measuring central tendency and decision trees for classification tasks can handle the outliers better.
- Imputing
Another method is to treat the outliers as missing values and then imputing them using similar methods that we saw while handling missing values.
References/Further reading:
https://www.analyticsvidhya.com/blog/2016/01/guide-data-exploration/
https://analysights.wordpress.com/2010/09/15/correcting-for-outliers/
https://www.itl.nist.gov/div898/handbook/prc/section1/prc16.htm
https://www.neuraldesigner.com/blog/3_methods_to_deal_with_outliers
https://www.kdnuggets.com/2017/02/removing-outliers-standard-deviation-python.html
https://towardsdatascience.com/ways-to-detect-and-remove-the-outliers-404d16608dba